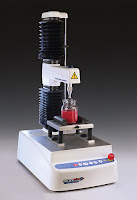
All Texture Analysers contain a load cell for force measurement. Load cells are components that convert a mechanical force signal into an electrical signal. They work by deforming in response to the applied force (the deformation being well below the elastic limit of any component materials). In most load cell designs provided by Texture Analyser manufacturers, deflection is measured by strain gauges bonded at points on the load cell, although piezoelectric load cells are also available. The strain gauges provide an electrical signal proportion to the applied load.
Capacity
The maximum force reached during the test must not be greater than the load cell capacity or an overload (in compression) or underload (in tension) will occur. On the other hand, the expected maximum force must not sit in the lower end of the load cell force range, as sensitivity may decrease in this region.
Accuracy and precision
Load cell accuracy can be affected by non-linearity, hysteresis, creep and temperature effects on output and zero. An improperly applied load (twisting or bending off-axis) causes the load cell to experience strain and send a signal change proportional to the twisting rather than the load’s weight. Consequently, rigs and probes are generally designed to ensure vertical loading. Each load cell specification shows an expected degree of accuracy and precision, generally varying with applied load and dependent on capacity.
Format
As well as capacity, strain gauge load cells vary by form. Stable Micro Systems supplies S-beam and cantilever load cells. Different formats can produce varying force-distance responses due to the variation in components used in their construction. Interchangeable load cells are supplied so the user may change the load cell capacity depending on their current application. Load cells are fixed in place by screws.
Non-linearity
Non-linearity is the maximum deviation from a straight line of the load cell calibration curve, starting at zero load and ending at its maximum rated capacity. This represents the error in force measurement over the load cell’s entire operating range. The smaller the change in weight applied to a load cell, the smaller the error resulting from non-linearity. A schematic diagram showing non-linearity on a load cell calibration curve is shown.
 |
| Schematic diagram showing non-linearity and hysteresis on a load cell calibration curve. This may take other forms depending on the Texture Analyser and load cell used |
Due to this non-linearity characteristic, force calibration is advisably carried out over the range of expected use. For example, a 10 kg load cell should not be calibrated using a 10 kg weight, then used to measure forces of a few grams. The measured force will divert from the calibration line at this lower end. On the other hand, a 100 kg load cell should not be calibrated with a 100 g weight, then used to measure tens of kg. The calibration line plotted between 0 and 100 g may not be representative of the behaviour of the whole range of the load cell.
Some mechanical factors influence the linearity of the load cell. These include the choice of fixing screws used to attach the load cell to the Texture Analyser, and the torque to which they are tightened. When loading to high forces, a load cell that is not fixed in place correctly may provide variable results. Consequently, the use of a torque wrench is helpful in maintaining uniformity of behaviour.
Hysteresis
Any given load cell has a certain amount of hysteresis in its load-unload behaviour when known weights are applied or removed. This is the difference in the output force reading for the same applied load in the following situations, using a target force of 5 kg as an example:
- Increasing the load from zero to 5 kg
- Decreasing the load from a larger applied load to 5 kg
Hysteresis is seen on a load-unload graph as a mismatch between the loading and unloading curves.
Temperature effects
Temperature changes can cause a variation in load cell measurements. This can be compensated for by re-calibrating the load cell after any large temperature changes. Further to this, many load cells have a degree of built-in temperature compensation. This is achieved by built-in temperature compensation resistors and careful design of the analogue components around the strain gauges.
Response time
Load cells used in Texture Analysers generally have a fast response time. However, as their overall behaviour is that of a stiff spring, when a load is quickly applied, the load cell will oscillate for a very short settling period. This is on the scale of tenths of a second or less in free air. Specifying the settling time is difficult for a generic situation, as the sample being tested can dampen the oscillation, changing the resonance of the load cell. While generally not a significant effect, it is important to be aware of this when performing tests that involve rapid movements.
Why not request a Features and Safety poster for placement near your instrument to inform users:
Or if you have lost it, request a 167 page (pdf) in-depth manual to be sent to you.
There is a Texture Analysis test for virtually any physical property. Contact Stable Micro Systems today to learn more about our full range of solutions.
For more information on how to measure texture, please visit the Texture Analysis Properties section on our website.
The TA.XTplusC Texture Analyser is part of a family of texture analysis instruments and equipment from Stable Micro Systems. An extensive portfolio of specialist attachments is available to measure and analyse the textural properties of a huge range of food products. Our technical experts can also custom design instrument fixtures according to individual specifications.
No-one understands texture analysis like we do!
Get in touch to discuss your specific test requirements
 |  |  |


No comments:
Post a Comment