A range of validation samples
The test method and settings that have been selected as having the highest promise now needs to be tested in practice over the full range of texture variability of the product from excellent quality to very poor quality. A minimum of three levels of textural quality is often suggested. Whilst the repeatability within a sample is important, ultimately the method needs to be able to differentiate between a product which is clearly different. If it doesn't provide distinctly different results for products which you know to be different (if only by testing with your own hands) then it's back to the drawing board.
Once you have chosen your test settings you need to verify that your chosen method is suitable and useful. Consider the following:
- When attempting to optimise test settings it is suggested that the first tests are performed on the hardest samples to anticipate the maximum testing range required and ensure that the force capacity allows testing of all future samples.
- Use your hands to feel the samples and verify that what you feel has been successfully detected with the Texture Analyser.
- We recommend that you test three different versions of the same sample – e.g. a good vs. a bad or a known hard vs. soft. If differences cannot be measured by the Texture Analyser between samples that are known to be subjectively different then further testing with this method is meaningless and you will need to reconsider what type of test is chosen or whether your repeatability is being compromised by the wrong selection of settings. If the method cannot differentiate between two clearly different (as felt by the hand or other means) samples then it will certainly not be suitable to differentiate between samples that are different but closer in property. Likewise, if two samples are presented which do not appear or feel different then there is a possibility that a Texture Analyser will also be unable to differentiate between samples.
- When viewing your results spreadsheet, it will include the average (mean) values, standard deviation and coefficient of variation. A low standard deviation or range indicates that the material in the sample has uniform properties (each of several specimens has nearly the same values for the measured properties) and that the test is producing consistent results. Conversely, a high standard deviation or range indicates that a problem of inconsistent material or testing exists and needs to be investigated.
- Once the extremes can be seen to clearly display markedly different curves or results then you need to look at the 'within-test' repeatability. If repeated tests of the same product are not reproducible then future results will not allow confident assessment of differences between products (i.e. if the standard deviations of two products are so high and overlap each other it is questionable whether they are 'different'. We suggest at least 10 samples should be tested to assess your 'within batch' repeatability.
Or if you have lost it, request a 167 page (pdf) in-depth manual to be sent to you.
There is a Texture Analysis test for virtually any physical property. Contact Stable Micro Systems today to learn more about our full range of solutions.
For more information on how to measure texture, please visit the Texture Analysis Properties section on our website.
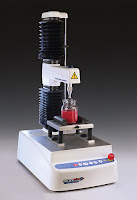
The TA.XTplusC Texture Analyser is part of a family of texture analysis instruments and equipment from Stable Micro Systems. An extensive portfolio of specialist attachments is available to measure and analyse the textural properties of a huge range of food products. Our technical experts can also custom design instrument fixtures according to individual specifications.
No-one understands texture analysis like we do!
Get in touch to discuss your specific test requirements
 |  |  |


No comments:
Post a Comment