Crispy: This term is often used to describe a light, delicate texture that breaks or shatters easily. Crispy foods are generally thin and have a certain level of dryness. When bitten into, they offer a sharp, quick break with little resistance. For example, a thin potato chip or a piece of fried chicken skin is typically described as crispy. The crispiness is often a result of the food's surface being subjected to high heat, resulting in a rapid dehydration and browning (like in frying or baking).
Crunchy: This term describes a firmer, more substantial texture. Crunchy foods require more force to break down and often result in a louder, more resonant sound when eaten. The texture is less about the surface quality and more about the internal structure of the food. Examples of crunchy foods include raw carrots, nuts, or thick-cut potato chips. The crunchiness is often inherent to the food's natural structure or is developed through processes like roasting or baking that affect the food more deeply than just the surface.
In summary, the difference lies in the texture's quality and the force required to break the food. Crispy is lighter and shatters more easily, while crunchy is denser and requires more force to break.
Let’s help your understanding by showing comparative curves of two types of breakfast cereal: Rice Crispies – small crispy particles vs. Frosted Cornflakes – larger crunchy pieces. Both were tested using an Ottawa cell to produce this typical example. Note: This is just an example comparison. Different products and products tested in a different manner will produce different curve profiles.
 |
| Graphical comparison of a crispy and crunchy product testing using an Ottawa cell (zoomed in section). |
We find that when measuring these two properties the crispy product produces a large amount of small fracture peaks compared to the crunchy product which produces peaks that have a much larger ‘dropoff’ after the fracture event. When analysing products of this fracturable nature we usually drop anchors at the start and maximum force point of the graph and between these 2 anchors measure the number of peaks (Count Peaks +ve in a macro) and the Linear Distance. Linear distance is the length of the force line that is created during the test as a result of the sample breakdown – a longer line would be obtained from a more fracturable product compared to a less fracturable one. We usually find that whilst the testing of a crispy and crunchy product may result in the same number of force peaks, the crunchy product possesses peaks that are much more dramatic resulting in a linear distance that is comparatively considerably higher. You will find a wide range of data analysis tools that are available for the testing of multi-peak/’jagged’ force profiles (the ones most suitable for brittle products are shown in red boxes).
 |
| Discover the data analysis techniques available in your Process Data menu |
 |
| Acoustic Envelope Detector |
Learn more about how an Acoustic Envelope Detector works.
What do others think?
There is a considerable amount of published data on the measurement of these brittle properties. Recently we discovered this online article which you might find of interest: The Difference Between Crispy And Crunchy, In Excruciating Detail.
And finally, you may also be interested in this user guide that discusses fracturability testing in general and the different ways that this property can be measured.
There is a Texture Analysis test for virtually any physical property. Contact Stable Micro Systems today to learn more about our full range of solutions.
For more information on how to measure texture, please visit the Texture Analysis Properties section on our website.
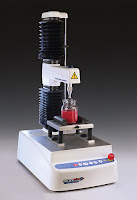
The TA.XTplusC texture analyser is part of a family of texture analysis instruments and equipment from Stable Micro Systems. An extensive portfolio of specialist attachments is available to measure and analyse the textural properties of a huge range of food products. Our technical experts can also custom design instrument fixtures according to individual specifications.
No-one understands texture analysis like we do!
Get in touch to discuss your specific test requirements
 |


No comments:
Post a Comment