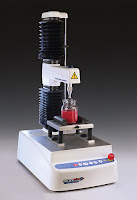
Texture Profile Analysis (TPA) is a widely used method in food science to evaluate textural properties. The test involves a double compression cycle of a bite-size piece of food using a compression probe that simulates the biting action. Data is then extracted from the resulting force-time curve to provide a number of textural parameters that correlate well with sensory evaluation of those parameters.
How the test works
 |
| Annotated typical TPA graph explaining how each stage is obtained |
Stage 1 – First compression cycle
Initial rise: The graph starts with a steep rise as the probe compresses the sample, indicating increasing force.
Peak force (First peak): The highest point (at anchor 2) during the first compression, representing the maximum force needed to compress the sample.
What it indicates: The initial rise and first peak measure the material's hardness or firmness. A steeper rise and higher peak indicate a firmer material. If there is another peak within this stage (before the highest peak) it is called Fracturability. It is not present for all samples and if absent the results spreadsheet will show N/A.
Stage 2 – Relaxation period/probe withdrawal
Shape: After the first peak, the force decreases as the probe withdraws. The positive area in this stage is due to the recovery of the sample from deformation.
What it indicates: This decrease can provide information on the sample's resilience.
Negative area (Adhesiveness)
Shape: After the first compression, if the probe encounters resistance as it withdraws, this creates a negative force area on the graph.
What it indicates: This negative area measures the adhesiveness of the sample, indicating how much force is required to overcome the attraction between the sample and the probe. Higher adhesiveness is indicated by a larger negative area.
Stage 3
This stage is where you choose to hold the probe at the trigger point for a time to allow sample recovery (if relevant).
Stage 4 – Second compression cycle
Second peak: The force increases again as the probe performs the second compression.
What it indicates: This second peak and area are usually lower than the first. The ratio of the second area to the first area (Cohesiveness) indicates the internal bonding strength. A higher ratio suggests better internal cohesion. The ratio of time difference between the second compression compared to the first indicates springiness. Only a perfect spring would produce a ratio of 1.
Stage 5 – Second relaxation period/probe withdrawal
Shape: Similar to the first relaxation, the force decreases as the probe retracts again.
What it indicates: The macro does not use this part of the curve for analysis.
Analysing the data to obtain textural parameters
The key features of the TPA graph provide insights into the material's mechanical properties, such as hardness, cohesiveness, springiness, and adhesiveness. Here's a more detailed annotation of where on a typical TPA graph the parameters are obtained from.
 |
| Explanation of how each TPA parameter is obtained from a typical curve |
Variations based on material properties
Hard and brittle materials: Show a steep initial rise and high first peak with much smaller second area indicating low cohesiveness and elasticity. These materials typically have low adhesiveness.
Soft and elastic materials: Display a more gradual rise to the first peak with no fracture peak present, and similarity between the first and second areas, reflecting high cohesiveness and elasticity. The negative area may be larger, indicating higher adhesiveness.
Gummy or sticky materials: May show a pronounced negative area after the second peak, indicating high adhesiveness. The peaks may not be as distinct due to the material's ability to deform and stick to the probe.
Firm but cohesive materials: These materials (like an elastic gel) might have similar first and second peaks, and minimal negative area, indicating good internal bonding and recovery and moderate adhesiveness.
To see a wide variety of graph shapes and interpretations go to the Texture Technologies TPA webpage and learn a lot more.
Learn more about Selecting the correct TPA procedure, understanding what problems can occur and choosing the best parameter settings, visit our updated TPA webpage.
Or if you have lost it, request a 167 page (pdf) in-depth manual to be sent to you.
There is a Texture Analysis test for virtually any physical property. Contact Stable Micro Systems today to learn more about our full range of solutions.
For more information on how to measure texture, please visit the Texture Analysis Properties section on our website.
The TA.XTplusC Texture Analyser is part of a family of texture analysis instruments and equipment from Stable Micro Systems. An extensive portfolio of specialist attachments is available to measure and analyse the textural properties of a huge range of food products. Our technical experts can also custom design instrument fixtures according to individual specifications.
No-one understands texture analysis like we do!
Get in touch to discuss your specific test requirements
 |  |  |


No comments:
Post a Comment