How to measure and analyse the texture of food, cosmetics, pharmaceuticals and adhesives.
Tuesday, 27 May 2025
Testing in the lab: Dough Inflation
The Dough Inflation System enables the rheological properties of dough to be measured during biaxial stretching, which is the deformation in the cell wall material surrounding an expanding gas bubble during proof and baking. It provides a precise, digital measurement of dough expansion under conditions of strain and strain rate similar to those encountered in baking producing graphical and spreadsheet data for optimising recipes, proofing, shaping and baking conditions.
How the Dough Inflation System works
Samples are prepared to a specific thickness in a container which includes a central hole in its base. The sample is inflated by volume displacement of air using a piston driven by a Stable Micro Systems TA.XTplusC Texture Analyser. Pressure during inflation is measured by a pressure transducer and the volume of the inflating dough sheet is calculated from the displacement of the piston.
Analysis of the data
The system together with dedicated software, combines ease of use with automatic data collection and project based data analysis to provide traditionally recognised rheological measurements or customer-created parameters from pressure, volume and time data.
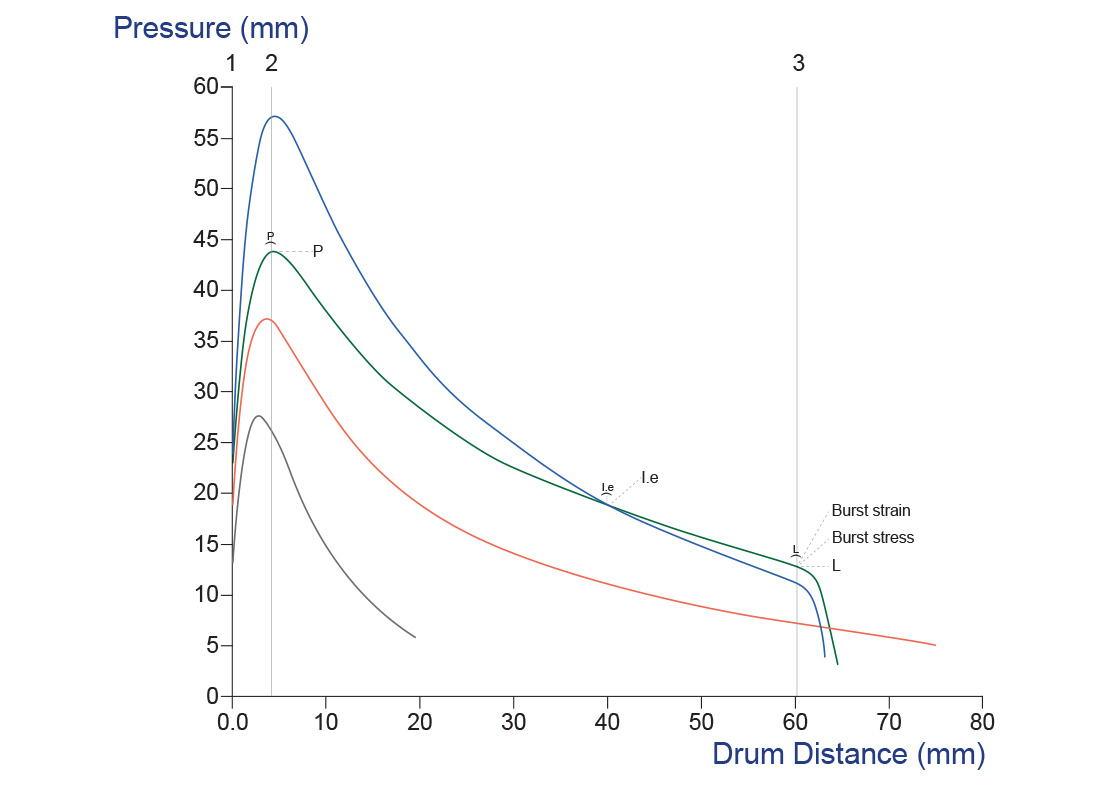
Typical dough inflation curve showing traditional measurements and the associated sample test point
How to interpret your data – traditional measurements
The Dough Inflation System provides traditional universally recognised measurements for tenacity, extensibility, elasticity, and baking strength (P, L, W and I.e. values) based on fundamental equations.
P (Y-axis): Tenacity - the maximum pressure (height of the peak) required during inflation of the sample. It is the capacity to resist deformation and at a given hydration it represents dough consistency e.g. whether the dough is hard or soft. It has also been claimed to be an indicator of dough tensile strength in the initial stage of deformation, related to the stiffness, shortness and tightness of the dough. Tenacity depends on water absorption capacity, protein quantity and quality, starch damage, fibres (pentosans, ash content).
L (X-axis): Extensibility - the length (mm) of the curve up to the point of rupture. It is a measure of how much the dough can be extended before it breaks and is related to the maximum volume of air that the bubble can contain. This value depends on protein quantity and quality and represents the dough’s gas retention capacity. It has a strong correlation with bread volume.
W (area under the curve): Baking strength - the deformation energy necessary to inflate the sample until rupture. This total area of the curve or total deformation energy value indicates dough baking strength and depends on protein quantity and quality, starch damage, enzymes, interactions. W is usually much larger for hard wheat flours than for soft wheat flours.
P/L: Configuration ratio of the curve or the maximum pressure required for deformation divided by the maximum amount of air that the bubble is capable of containing. It represents the balance of the elastic and viscous components of the dough. High P/L indicates a resistant and inextensible dough, while low P/L indicates a weak and extensible dough.
Ie: Elasticity index – represents the capacity of dough to stretch and return to its initial position when the stress ends. It compares pressure after 200 mL volume of air has been blown into the dough test piece or bubble versus the maximum pressure (P).
Example data
No single type of flour is inherently "better" than another; the suitability largely depends on the specific production process and the final product being made. For example, flour with lower tenacity (P value) might be ideal for making cookies or wafers, whilst a higher tenacity flour would be better suited for products like sliced bread or panettone.
The Dough Inflation System can help you identify the key characteristics of dough that are best suited for your desired end product.
There is a Texture Analysis test for virtually any physical property. Contact Stable Micro Systems today to learn more about our full range of solutions.
TheTA.XTplusC Texture Analyser is part of a family of texture analysis instruments and equipment from Stable Micro Systems. An extensive portfolio of specialist attachments is available to measure and analyse the textural properties of a huge range of food products. Our technical experts can also custom design instrument fixtures according to individual specifications.


No comments:
Post a Comment